 So after bugging the entire IT department and interrogating as many business teams as possible to grant you (the security guy) access to their data, you are finally in the process of developing your dreamed use cases. Lucky you!
Most SIEM projects already fall apart before reaching that stage. Please take the time to read a nicely written article by SIEM GM Anton Chuvakin. In case you don’t have the time, just make sure you check the section on “Mired in Data Collection”.
The process of conceptualizing, developing, deploying and testing use cases is challenging and should be continuous. There are so many things to cover, I bet you can always find out something is missing while reading yet another “X ways to screw up a SIEM” article.
So here’s another idea to prove it once again: how can you make sure the events are safely arriving at your DB or index? Or even beyond: how can you make sure the timestamps are being parsed or extracted appropriately? Why is it important?
Time is what keeps everything from happening at once.
First of all, I’m assuming the Splunk terminology here, so it’s easier to explain by example. Also, let’s make two definitions very clear:
Extracted time: corresponding to the log generation time, coming from the log event itself. This one is usually stored as _time field in Splunk.
Index time: corresponding to the event indexing time, generated by Splunk indexer itself upon receiving an event. This one is stored as _indextime field in Splunk.
There are infinite reasons why you should make sure timestamps are properly handled during extraction or searching time, but here are just a few examples:
- Timezones: this piece of data is not always part of the logs. So time values from different locations may differ – a lot;
- Realtime/Batch processing: not all logs are easily collected near realtime. Sometimes they are collected in hourly or daily chunks;
- Correlation Searches (Rules) and forensic investigations are pretty much relying on the Extracted Time. Mainly because that’s the default behavior, either from the Time Picker (Search GUI) or the Rule editor.
Have you noticed the risk here?
Going under the radar
In case you haven’t figured out yet, apart from all other effects of not getting events’ time right, there’s a clear risk when it comes to security monitoring (alerting): delayed events may go unnoticed.
If you are another “realtime freak”, running Correlation Searches every 5 minutes, you are even more prone to this situation. Imagine the following: you deploy a rule (R1) that runs every 5 minutes, checking for a particular scenario (S1) within the last 5 minutes, and firing an alert whenever S1 is found.
For testing R1, you intentionally run a procedure or a set of commands that trigger the occurrence of S1. All fine, an alert is generated as expected.
Since correlation searches and, in fact, any search, scheduled or not, runs based on Extracted Time (_time) by default, supposing that S1 events are delayed by 5 minutes, those events will never trigger an alert from R1. Why?
Because the 5-minute window checked by the continuous, scheduled R1 will never re-scan the events from a previous, already checked window. The moment those delayed events are known to exist (indexed), R1 is already set to check another time window, therefore, missing the opportunity to detect S1 behavior from delayed events.
What can be done?
There are many ways to tackle this issue but regardless of which one is chosen, you should make sure the _time field is extracted correctly – it doesn’t matter if the event arrives later or not.
Clock skew monitoring dashboard
The clock skew problem here applies to the difference between Indexed (_indextime) and Extracted (_time) values. Assuming near realtime data collection, those values tend to be very close, which implies it’s completely fine to have them out of sync.
Folks at Telenor CERT were kind enough to allow me to share a slightly simplified version of a dashboard we’ve written that is used to monitor for this kind of issue, we call it “Event Flow Tracker”.
The code is available at Github and is basically a SimpleXML view, based on default fields (metadata). It should render well once it’s deployed to any search head.
Here’s a screenshot:
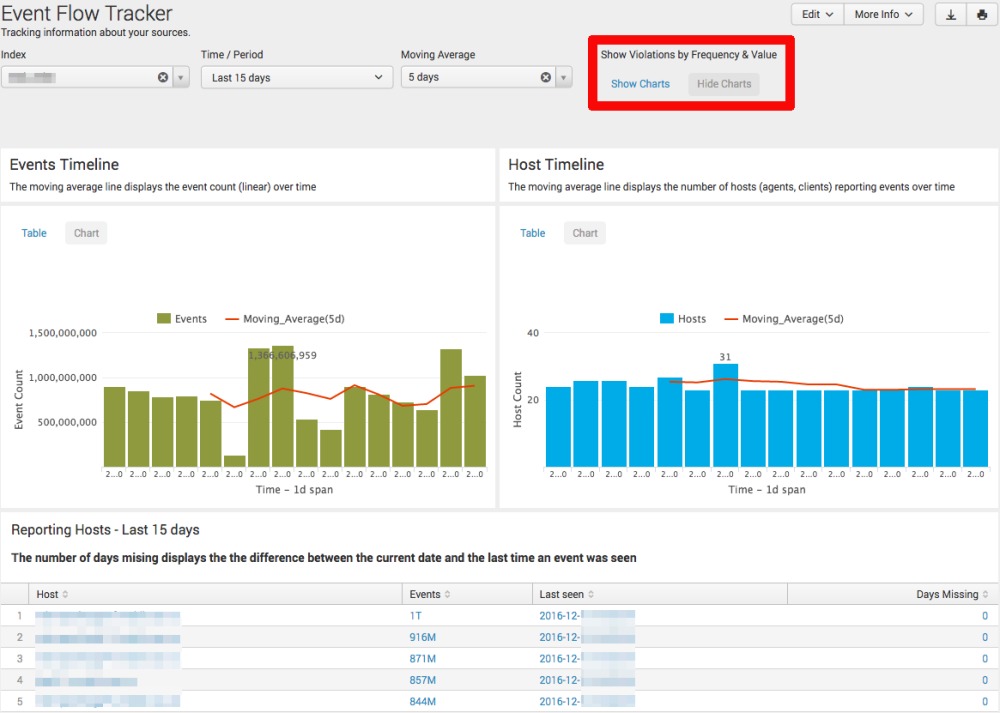
Since searches rely on metadata (tstats based), it runs pretty fast, and also tracks the event count (volume) and reporting agents (hosts) over time. Indexes are auto-discovered from a REST endpoint call, but the dashboard can also be extended or customized for specific indexes or source types.
When clicking at “Show charts” link under Violations highlighted in red, the following line charts are displayed:
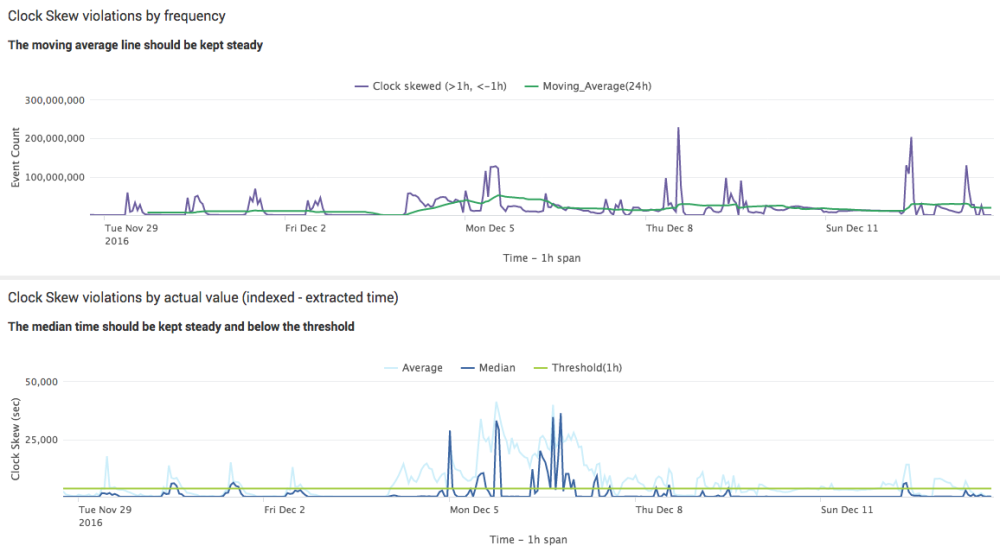
So assuming a threshold of one hour (positive/negative), with the visualizations it’s easier to spot scenarios when those time fields are too different from each other.
The first chart shows how many events are actually under/above the threshold. The second chart depicts how many seconds those events are off in average.
How to read the charts?
Basically, assuming median as the key metric, in case the blue line (median) is kept steady above the green line (threshold), it might be related to a recurring, constant issue that should be investigated.
Since the dashboard is based on regular queries, those can be turned into alerts in case you want to systematically investigate specific scenarios. For example, for events that must follow strict time settings.
The dashboard is not yet using the base search feature, so perhaps it’s something you could consider in case you want to use or improve it.
Writing Rules – Best practices
Now, assuming the risk is known, that is, some events may land on the indexers a bit later due to a transport bottleneck (network, processing queue, etc), how to write reliable rules?
Delayed detection?
If data is not there yet, how can you reliably detect anything? This is an obvious decision. You should always consider capturing as much signal as you can in order to trigger a high-quality alert.
If you are into “realtime detection”, I suggest you consider checking how many events you might have missed due to this problem (delayed events). I’m more into detecting something with accuracy, even if a bit delayed, rather than trying to detect something almost immediately risking less accuracy or even the lack of alerting.
Also, depending on your search query (density, constraints, etc), you may gain some extra resource power by increasing the interval and time boundaries from your rules.
As a side note: reports say organizations take days if not months to detect a breach, but some insist on realtime detection. Is that what Mr. Trump tried to convey here?
Time boundaries based on Index Time?
Yes, that’s also an option. You can search based on _indextime. So basically, as soon as the event is indexed, no matter how off the Extracted time (_time) is, it may be consider for an alert.
The downside of it, besides adding more complexity when troubleshooting Throttling/Suppression, is that you need to carefully review all your drilldown searches from another perspective, taking _indextime into account. In other words, the searches should always specify _index_earliest and _index_latest. More info here.
References
Event indexing delay
http://docs.splunk.com/Documentation/Splunk/6.5.1/Troubleshooting/Troubleshootingeventsindexingdelay

One Comment
Comments are closed.